8,000+ mobile communication towers. Multiple operators on each one.
Every operator installs antennas on their own schedule, removes old ones when it suits them, upgrades equipment without filing a report — or files one months later. Sometimes never.
The tower company is supposed to know what’s on their towers. In practice, nobody does.
That’s the problem. Not a data problem. Not a software problem. A reality problem: the physical world keeps changing, and no one is watching closely enough to keep up.
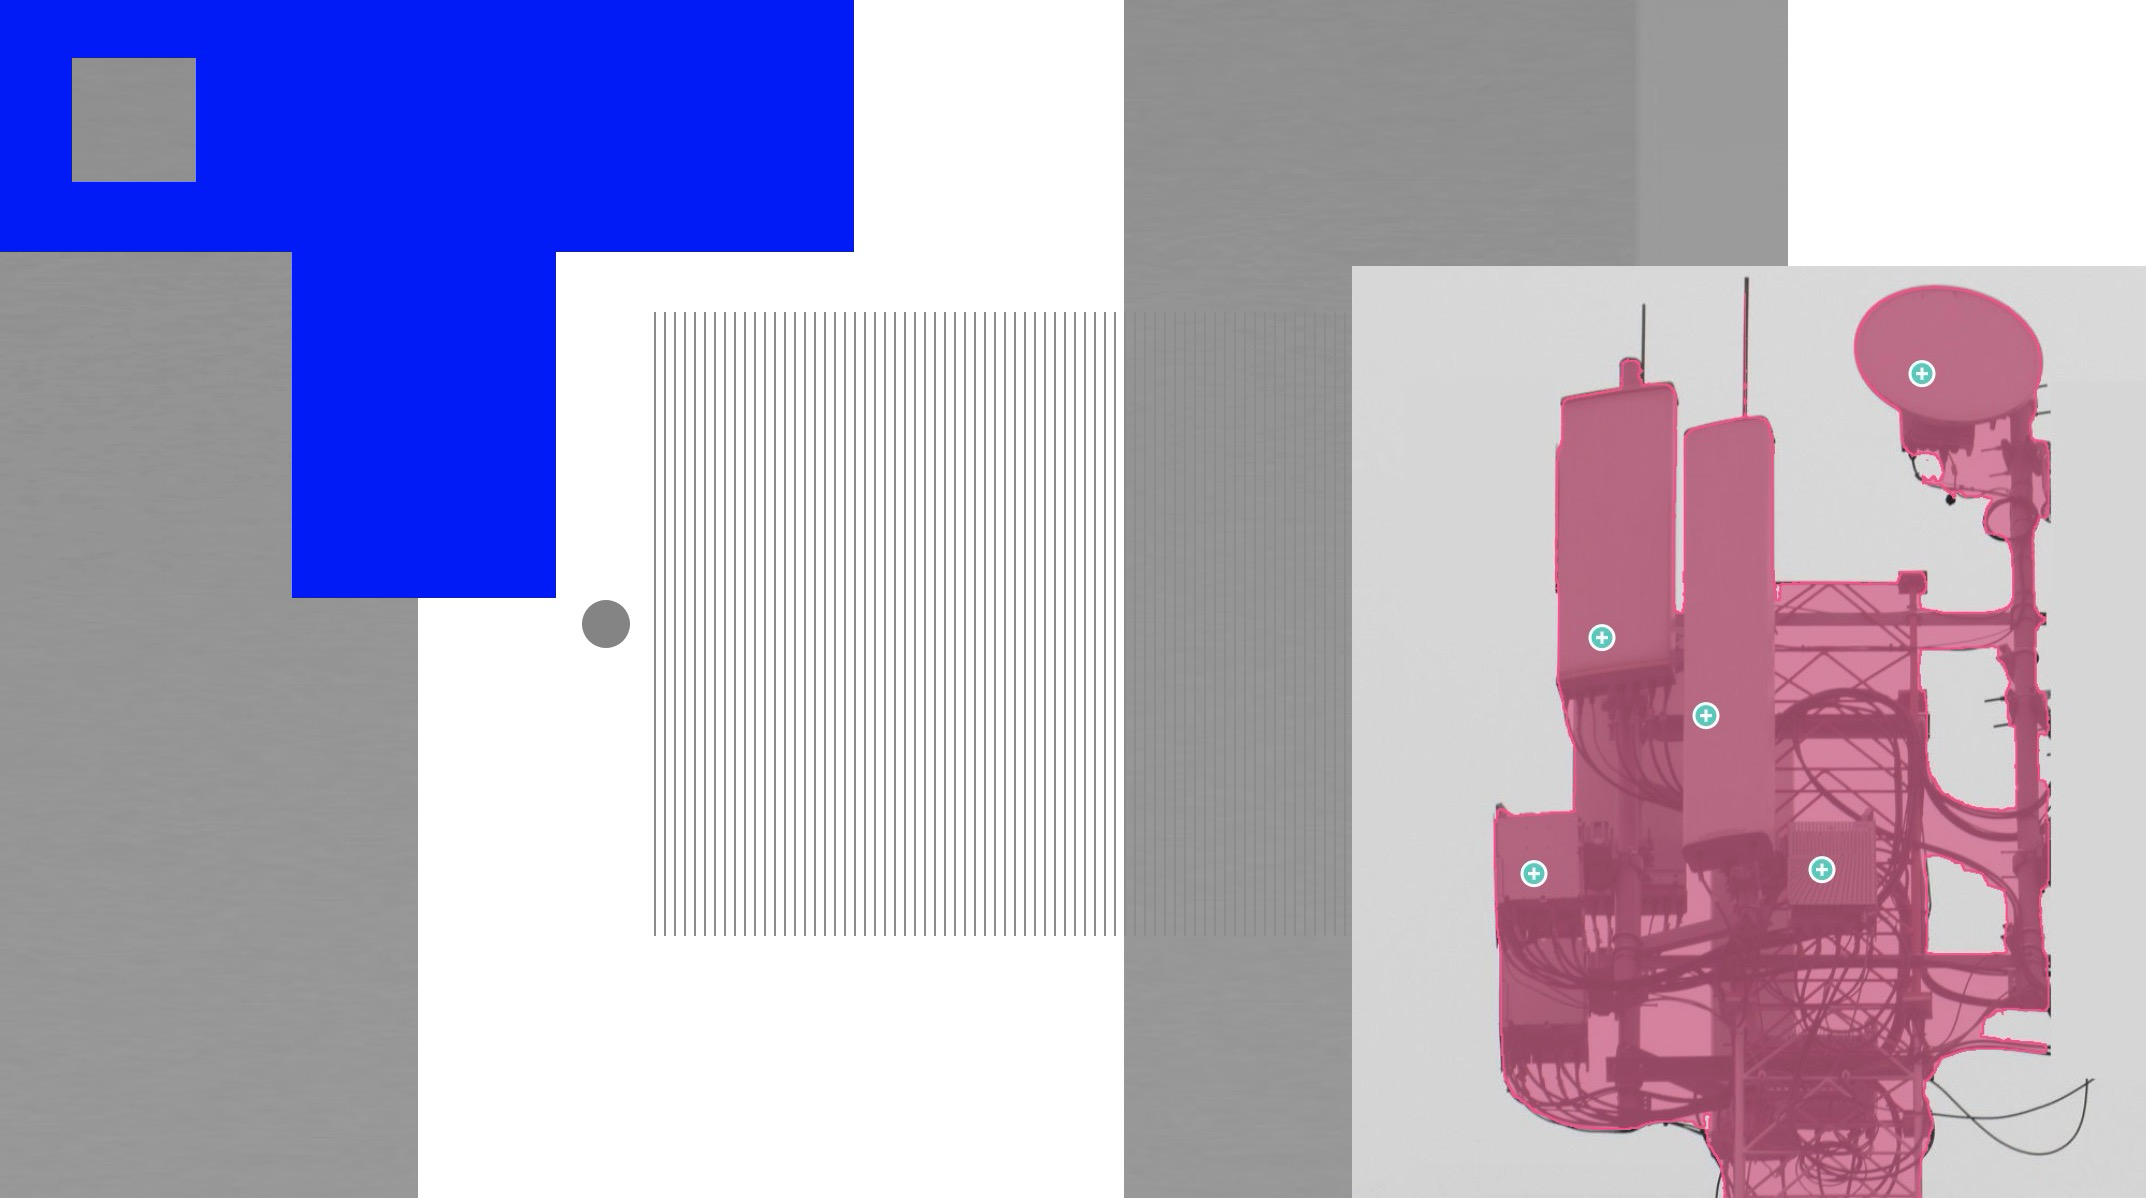
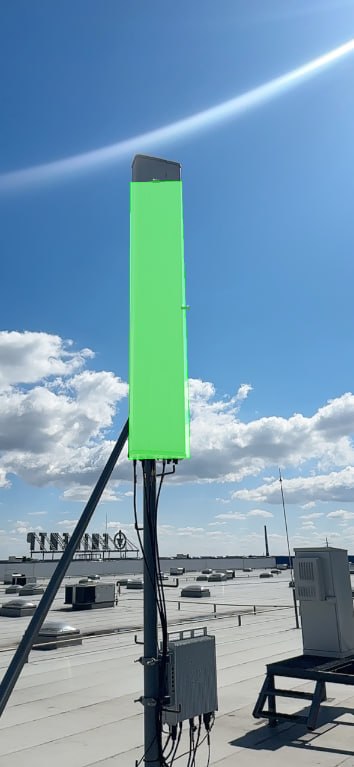
A typical mobile tower carrying equipment from multiple operators
The Only Source of Truth
Inspections happen several times a year per tower. Each one produces about a dozen photos — different angles, different lighting conditions.
That’s it. That’s the only reliable record of what’s actually out there.
No database stays current. No operator report can be trusted completely. Spiral Technology built the entire system on that premise: if the answer exists anywhere, it’s in the photos.
The task was to make the photos machine-readable — and turn them into a living tower passport.
Three functions. No exceptions:
- Antenna Detection — identify and locate every antenna in every photo
- Passport Generation — build a structured, parameterized description of each tower
- Automatic Updates — refresh the passport after each new inspection, with minimal human input
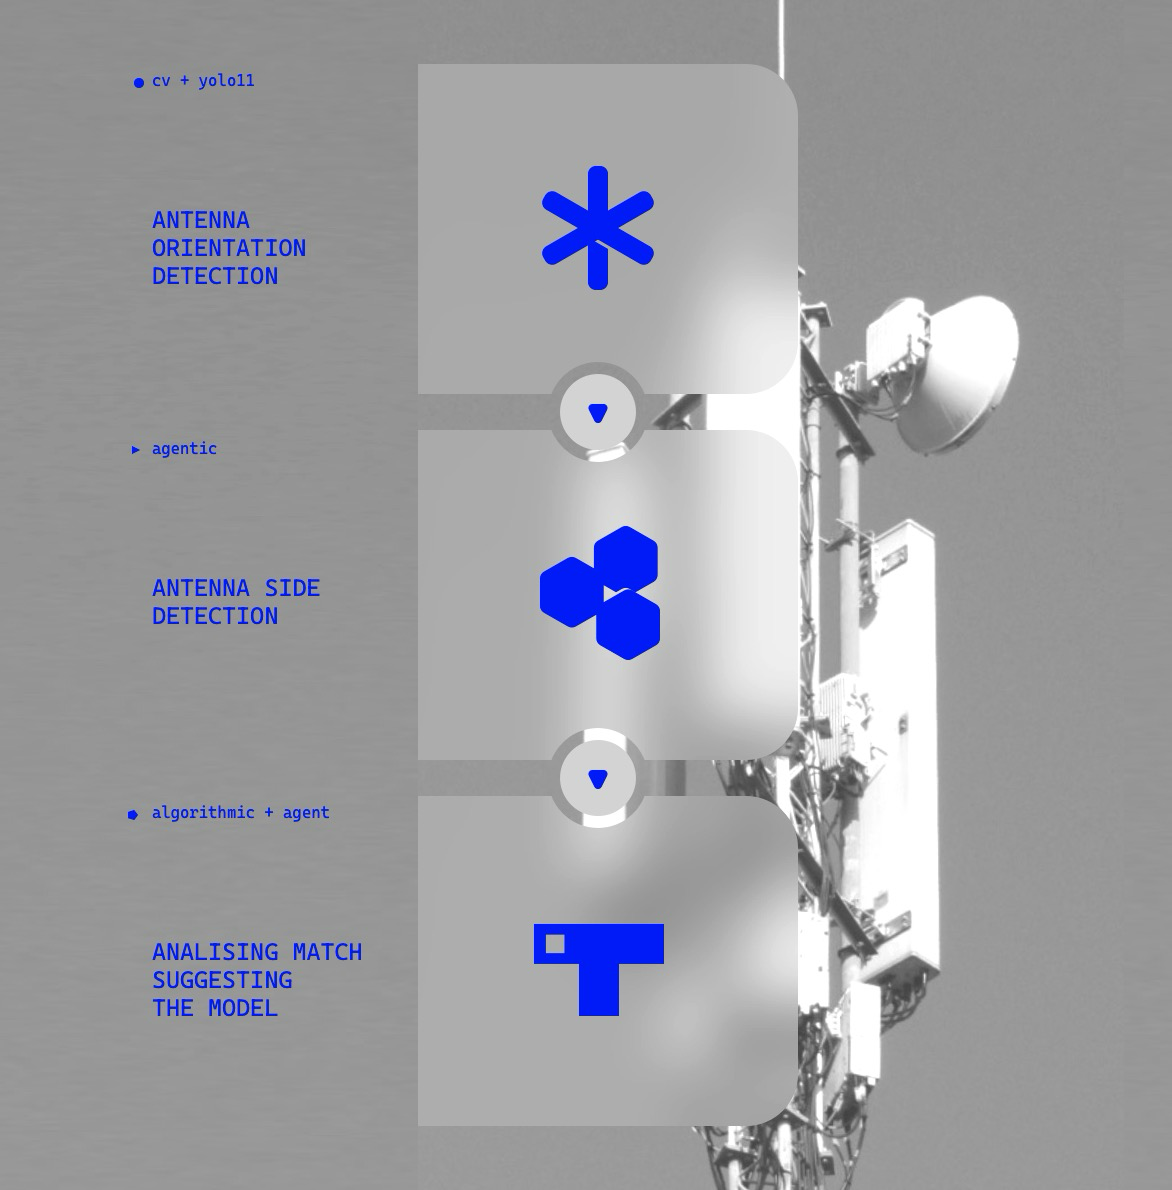
Detection: What the Models Actually Do
Tens of thousands of photos. Enough to train on from day one.
The first detection models — classifying antennas by type (panel, dish, radio module) — were up and producing reliable results within weeks. The approach: a separate YOLO model per antenna type, each tuned to the specifics of what it’s looking for.
Why separate models?
- Dish antennas come in three variants, 80% covered by one standard 30cm type — simple
- Radio modules are nearly uniform in size — always one class
- Panel antennas vary widely in size and model — complex, and the most important for maintenance
Same fast-iteration loop — small annotated seed, purpose-trained models, no manual labeling at scale — that powers Inventor, Spiral’s visual inspection platform for manufacturing.
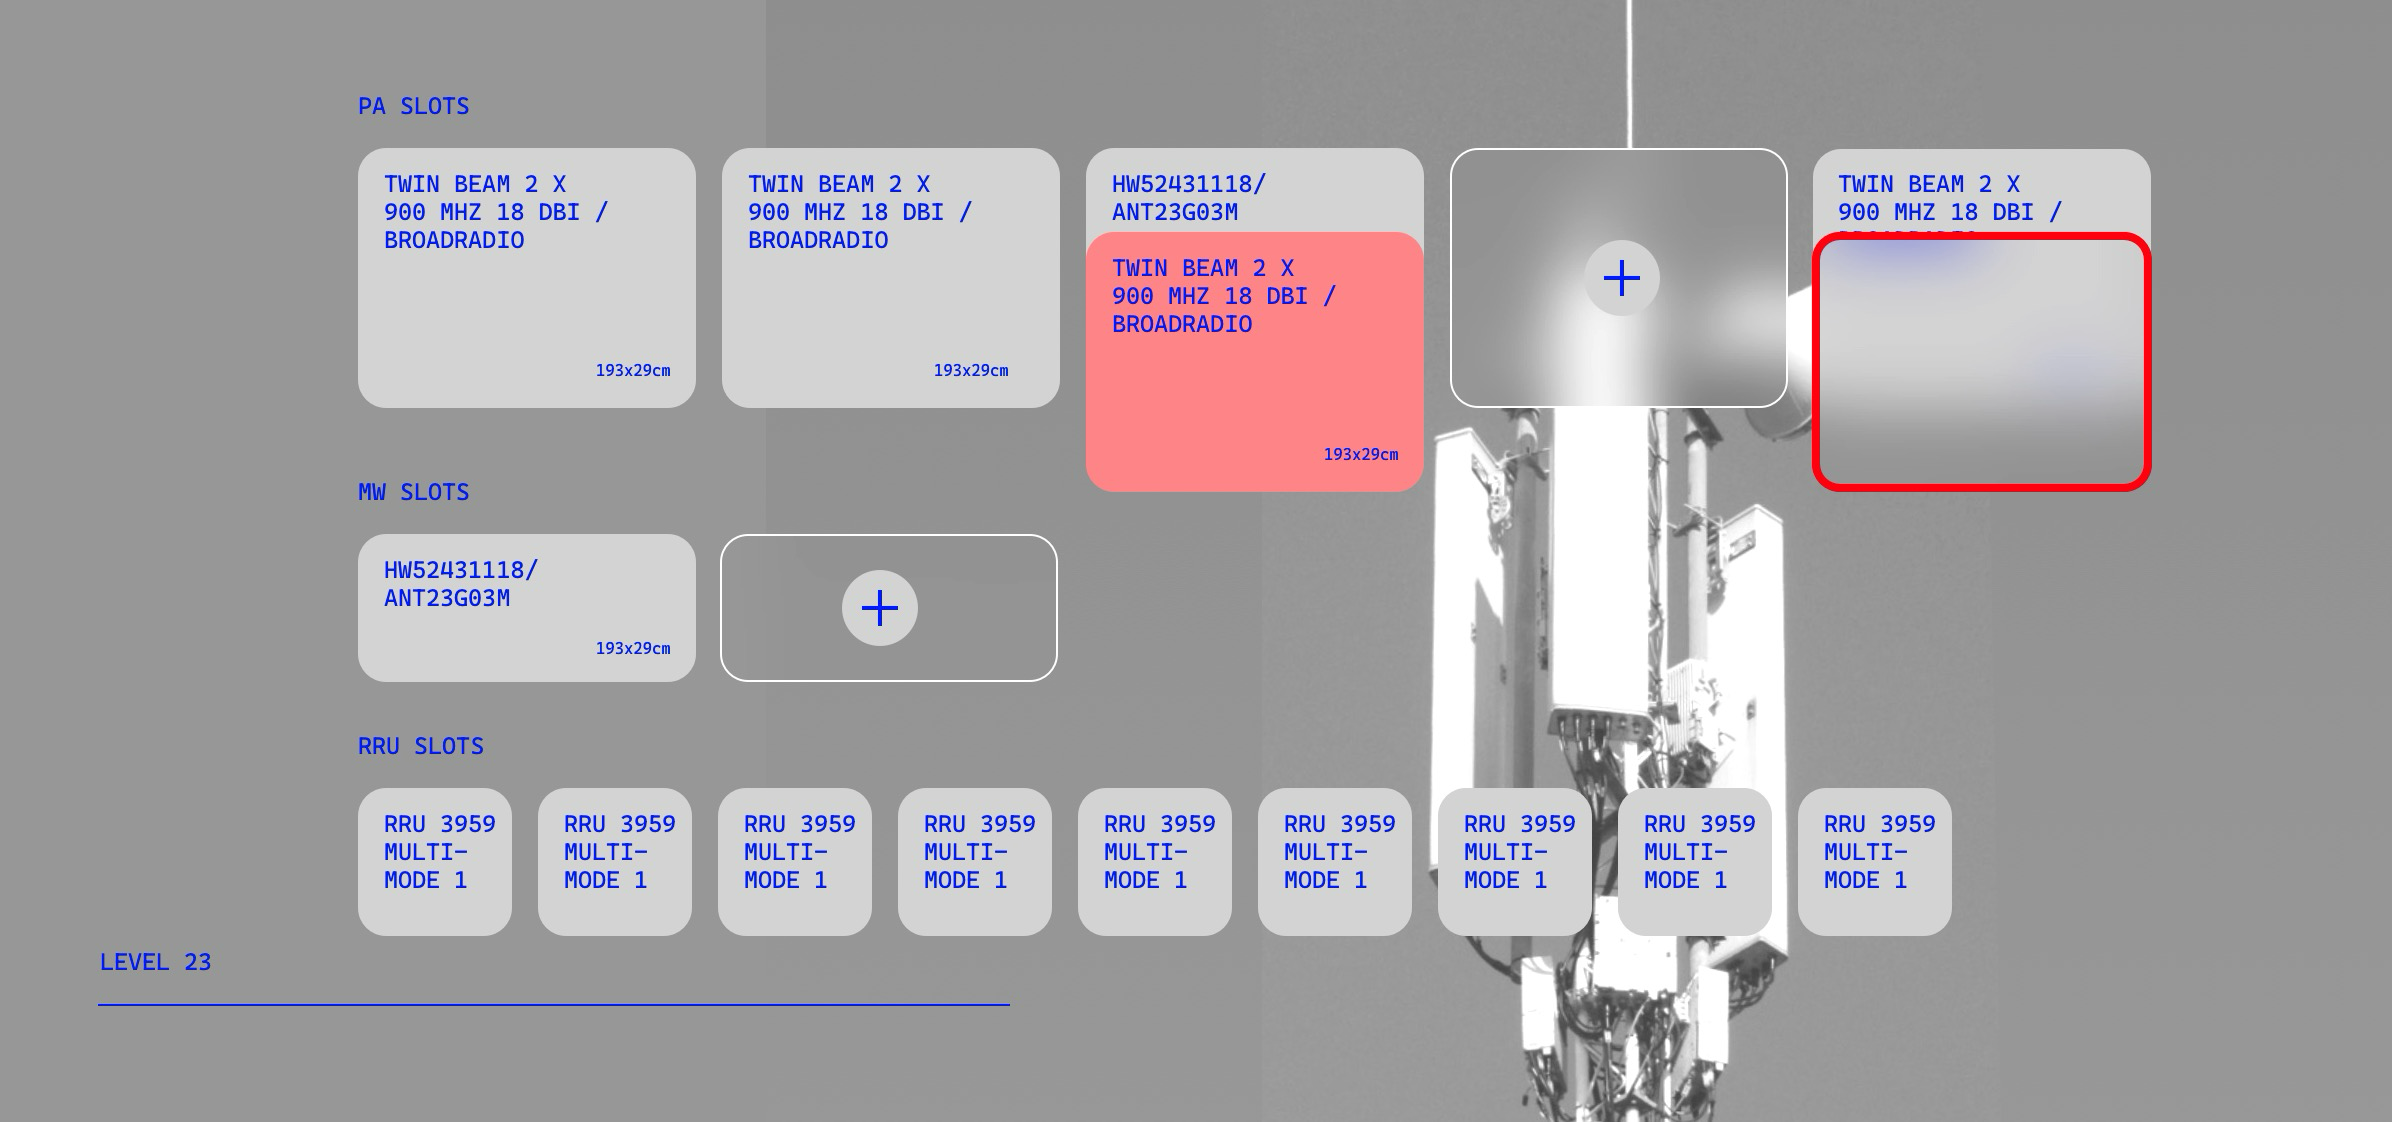
Finding antennas is one thing. Duplicates are another.
The same antenna can appear in three or four photos from different angles. The system has to recognize it’s the same object and consolidate into one passport record — not create three entries for one antenna.
To solve this, a separate model was trained specifically on antenna orientation — distinguishing which direction a panel is facing relative to the camera.
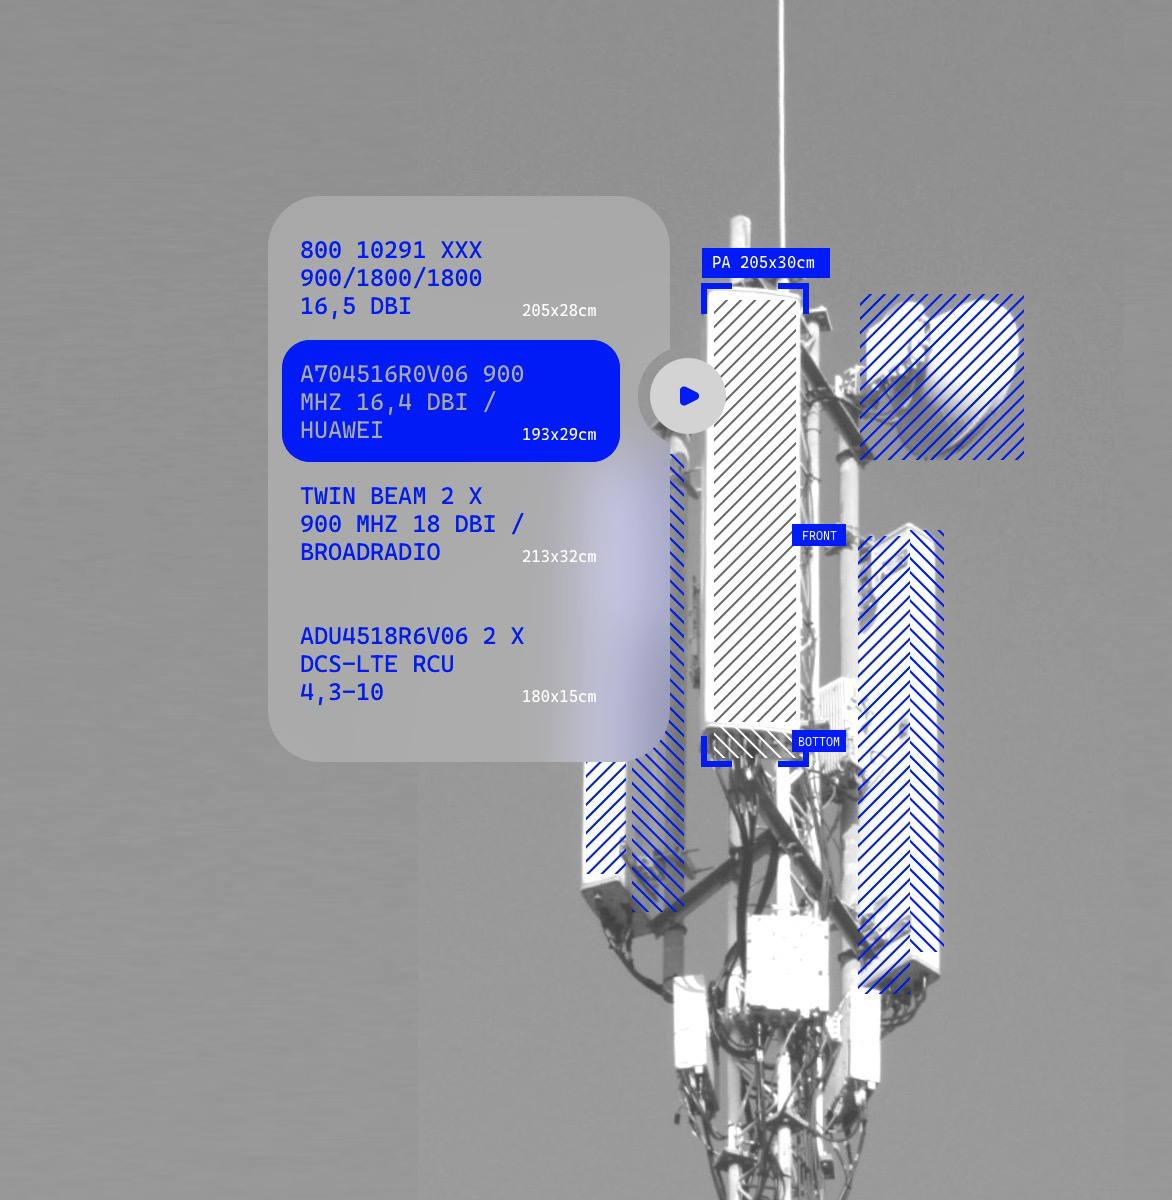
Panel Antennas: The Hard Part
Dish antennas are easy. Radio modules are easy. Panel antennas are neither.
They’re the most variable in size. They’re the most critical for coverage calculations. And to actually use them in network planning, three parameters must be known precisely:
| Parameter | Why it matters |
|---|---|
| Orientation (azimuth + tilt) | Determines where the signal points |
| Model type (manufacturer, series) | Defines the radiation pattern and gain |
| Geometric dimensions (height × width) | Sets the grid period and resonance margin |
Miss any one of them, and the antenna is useless for coverage planning.
Panel antenna detection: orientation, model type, and geometric dimension estimation
Finding the Size
This is where simple computer vision stops working.
Approach 1 — Geometry
Calculate the antenna’s pixel area. Pick a reference object with known dimensions. Derive a scale. Apply it.
Sounds reasonable. Falls apart immediately.
- Distant objects occupy fewer pixels (perspective)
- Shooting angle distorts the projection
- Different cameras with unknown optical parameters
- Focal length is unknown — linear assumptions break down
Result: 30–50% accuracy. Not usable.
Approach 2 — Classification
If the model can identify the antenna model (Huawei AAU6681T, Nokia BT3G…), dimensions come from the catalog. No geometry required.
Train on 10–15 PA classes with annotated photos. Match detections to known specs.
Result: ~55% accuracy. Better. Still limited:
- Only works for classes the model has seen
- Similar-looking models can differ significantly in actual size
Approach 3 — Iterative Fine-tuning
Start small. Expand deliberately.
Iteration 1: Train on 5–7 well-documented PA types from sites with few antenna variants and reliable records.
Iteration 2: Find sites with a single PA type the model doesn’t yet handle confidently. If the records are trustworthy, use them as new annotations. Retrain.
Result: ~70% on known classes. The catch: sites clean enough to seed iteration 1 are rare.
Iterative fine-tuning: seed sample selection (left) and annotation expansion across new sites (right)
LIDAR: The Parallel Track
Throughout the project, a separate thread was running alongside the vision work. Early-stage. Experimental. But it never stopped.
Industrial LIDARs were the first idea — full 3D reconstruction of the tower and everything on it. Accurate. Expensive. Slow. Requires specialist equipment and specialist processing.
For 8,000 towers, that math doesn’t work.
iPhone LIDAR opened a different door.
iPhone LIDAR has a 5m range limit — useless for scanning a tower from the ground. But nearly a third of towers sit on rooftops. And rooftop access means close range.
So an app was built. Spiral Technology’s LIDAR and AR work goes back years — most directly through Roboscope, which applies the same iPhone AR pipeline to defect logging on wind turbine blades. The tower app draws on the same foundation.
iPhone LIDAR scan of rooftop tower equipment — ~1% dimensional error at up to 5m range
Dimensional error: ~1%. The method works. Scaling it to ground-based towers is the next problem.
Work on that is ongoing. No results yet — regular field testing takes time, and the conditions are harder to control.
Accuracy Across Approaches
| Approach | Accuracy | Notes |
|---|---|---|
| Geometry (Approach 1) | ~30% | High error margins, low variance |
| Class model (Approach 2) | ~55% | Medium variance, limited coverage |
| Iterative fine-tuning (Approach 3) | ~70% | Strong on known classes, weak on new ones |
| Hybrid (Approach 4) | ~75% | Balanced, most manageable at scale |
What Actually Works
Not the most elegant approach. Not the most complete one.
The hybrid — classification as a base, iterative expansion on top, LLM-assisted quality control — is what runs in production. It moves forward not by being perfect, but by being right more often than last month.
Hard-won knowledge. Model reconciled with reality. Automated checks at each step.
That’s how you inventory 8,000 towers without burning out the annotation team.